


Urbanization
Originally published in September 2018; substantially updated in May 2026.
The world today is predominantly urban. Around 80% of people live in cities, towns, and suburbs rather than rural areas.
This page looks at urbanization globally: how populations are distributed across different types of settlements; which cities are growing fastest and how dense they are; what living conditions in urban areas look like; and how urbanization relates to broader patterns of development.
Because all of this depends on how “urban” is defined, the page also explains the main ways it’s measured, and what to keep in mind when using the data.
What is urbanization, and why does it matter?
Urbanization is the migration from rural areas into towns and cities. Over the past century, billions of people have made this move.
Tracking these patterns is important because where people live shapes many aspects of their lives: how they work and move around, who they interact with, and the opportunities and risks they face. It also shapes what governments need to provide — from housing and transport to healthcare and schools.1
But to track these trends and plan for them, we first need to agree on what counts as urban. That is not as simple as it sounds.
The world’s population is spread across a range of settlements, from isolated houses and farms to megacities and everything in between. Drawing the line between urban and rural is not straightforward, and national statistical offices often use different criteria. The same town might be considered urban in one country and rural in another. This makes it hard to compare urbanization trends across countries.
One way around this comparability issue is to go beyond a binary country-level category and instead use satellite images and population data to measure two things: how dense settlements are, and how many people live in them. Analysts can then apply a consistent classification across countries.
This is the approach the United Nations has adopted for its headline figures in the 2025 Revision of the World Urbanization Prospects.2 It applies the same population and density standards across countries to differentiate three categories of settlement:
- Cities, which are the largest and densest places: at least 1,500 people per square kilometer, and at least 50,000 people in total.
- Towns and suburbs, which are the middle ground: at least 300 people per square kilometer, and at least 5,000 people in total.
- Rural areas, which are smaller and more sparsely populated: villages, small clusters, and isolated settlements.
This is the data we draw on throughout this page. Below, we explain this framework, called Degree of Urbanisation (DEGURBA), in more detail and explain how it differs from earlier measurement standards.
Urbanization across the world today
How many people live in cities, towns, and rural areas?
In 2020, around 3.5 billion people lived in cities, another 2.8 billion in towns and suburbs, and around 1.6 billion in rural areas. This means that cities are home to 44% of the global population, with 36% in towns and suburbs, and 20% in rural areas.
From a historical perspective, this is a dramatic shift. Even as recently as 1950, only around 20% of the world’s population lived in cities by this definition.
You can explore the data for any country or region using the options on the interactive chart. The chart also allows you to compare regional distributions side by side.

One pattern that stands out is how similar the distributions are across regions with very different income levels. Africa and Europe, for example, have similar shares of their populations in cities, towns, and rural areas — a fact that cuts against the common assumption that urbanization tracks closely with prosperity. We discuss this relationship and why it is weaker than many people expect in the section on urbanization and development.
Another pattern worth noting is how stable the towns-and-suburbs share has been everywhere. Across most regions, it has stayed between 30–40% for decades. The main change has been the growing share of the population in cities and the declining share in rural areas.
Do more people live in urban or rural areas?
It’s intuitive to look for the point in time when the world transitioned from a majority rural to a majority urban population. But the crossover point, and the answer to the headline question, depends on how “urban” is defined.
If we group cities and towns together, then around 80% of the world’s population now lives in urban areas. By this measure, the world has been mostly urban since at least the 1950s, the earliest point in the dataset. You can see this in the chart below.

This is much earlier than you might have seen from UN reports, which announced that “the world became majority urban in 2007”, a milestone that received a lot of attention at the time.
These timelines are so different because the older UN series used a different approach to measure urbanization, relying on national definitions rather than a shared international standard. We explain these measurement differences in more detail below, and you can explore the urban vs. rural split based on those alternative national definitions.
In the previous chart, we grouped cities and towns into a single category.
What if we treat them separately? This is what the next chart shows.
In 1950, as many people lived in towns as in rural areas globally. In cities, there were half as many. The story over the past 70 years, then, has been the rise of cities and the decline of rural populations. By 1980, cities had overtaken rural areas, and by the early 2000s, they overtook towns to become the most common type of settlement.

Where is the shift to urban areas happening the fastest?
In recent decades, sub-Saharan Africa has been the world’s fastest-urbanizing region.4
Nigeria, in the chart, illustrates the scale of this change. In 1950, only around 1 in 10 Nigerians lived in a city. Today, it is nearly 1 in 2.

Europe and the Americas urbanized earlier, and the pace in these regions has since slowed.
This pattern reflects a broader shift in how urbanization happens. Historically, rapid urbanization was often closely tied to industrialization, but today, in many lower-income countries, it is happening under different economic conditions. We discuss this in more detail in the section below on urbanization and development.
City populations and density
What are the largest cities in the world?
The next chart ranks the largest cities in 2020 by population, using the Degree of Urbanisation framework, which defines cities by contiguous high-density settlement rather than administrative boundaries. This means that some of the cities shown here extend well beyond official municipal boundaries.
Jakarta, Indonesia’s capital, is the world’s largest city in this dataset. Its population has increased tenfold since 1950.5

How fast are the world’s largest cities growing?
The next chart shows population estimates for a selection of the largest cities since 1950 — you can add others using the chart controls.
Some of the largest cities today, like Jakarta, Dhaka, New Delhi, and Karachi, are also among those that grew fastest. Other megacities like Tokyo and New York, which grew much earlier, have seen slower growth in recent decades.

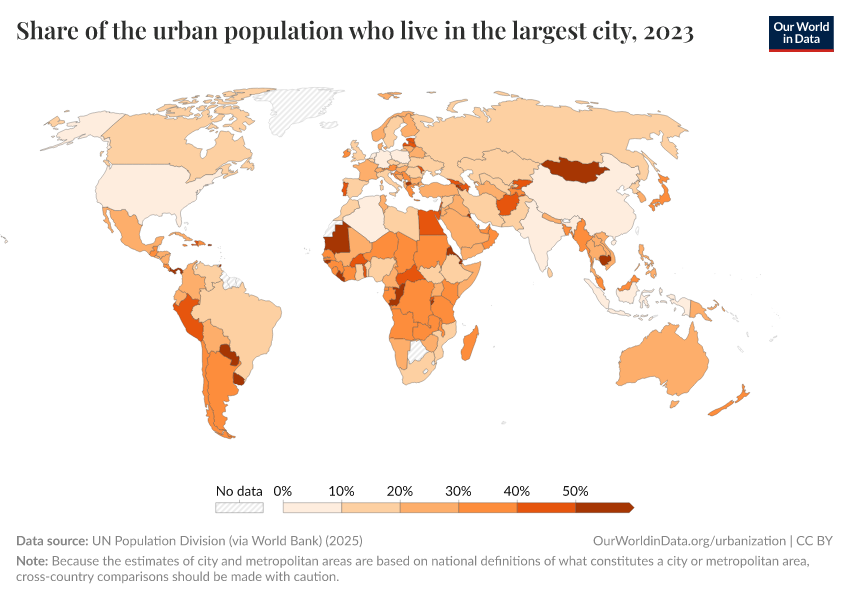
How many people live in capital cities?
Capital cities differ widely in size and role. In some countries, the capital is mainly an administrative seat, relatively small and distinct from the country’s economic center (for example, Canberra in Australia). In others, the capital is also the largest city, home to tens of millions of people and much of the country’s economic activity.
The map shows this variation by plotting the share of each country’s population living in its capital.
As you can see, the range is large. At one end are city-states such as Singapore, where almost everyone lives in the capital; at the other are countries such as Brazil, where the capital (Brasilia) accounts for less than 1% of the total population.6

The next chart shows the same data in terms of the total number of people living in each capital city. It highlights the ten largest capital cities in the world, but you can explore other countries and future projections using the interactive options.

How densely populated are cities around the world?
Population tells us how many people live in a city, but it doesn’t tell us how this relates to space. Two cities can have similar populations but feel very different if one is tightly packed while the other sprawls across a larger area.
The chart below plots population density, measured here within the city’s footprint (as defined by the Degree of Urbanisation framework rather than by administrative boundaries).
The differences are very large: Hong Kong has around 7,000 people per square kilometer, while Karachi, in Pakistan, has over 27,000.
The chart also shows how density changes over time, and how cities follow different paths. Some become more crowded as they grow; others expand outward, spreading their population over more land. Hong Kong, for example, continued to grow in population over the last decade without becoming more crowded. Karachi and Surat, by contrast, became steadily denser.

Shanghai and New Delhi offer another interesting comparison. In the 1970s, both had around 6,500 people per square kilometer. By 2020, both had grown to similar population sizes, but New Delhi became about 50% more crowded: over 14,000 people per square kilometer, compared to Shanghai’s 9,500.
Do most people live in big cities or small ones?
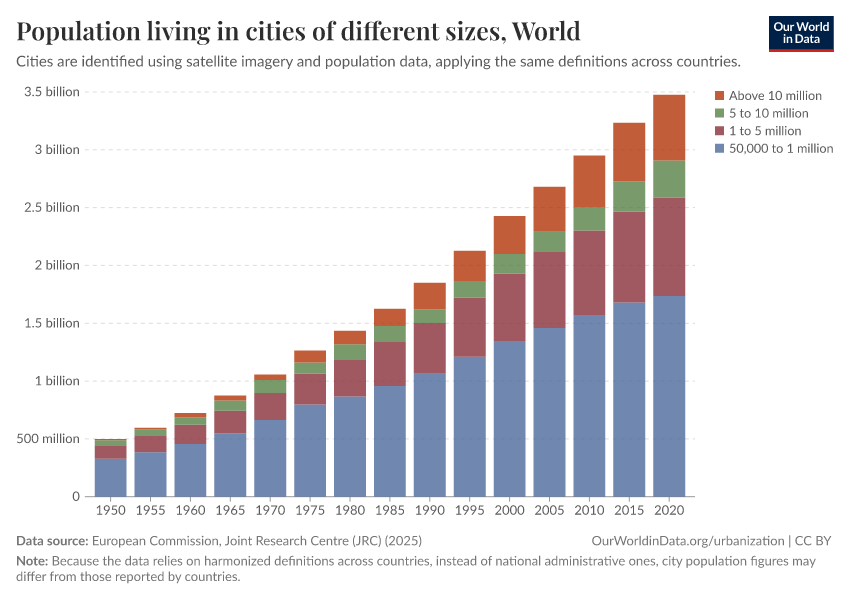
For an urban settlement to count as a city under the harmonized UN framework, it needs a total population of at least 50,000 (in addition to a density of at least 1,500 people per square kilometer). That means the range in city populations in the dataset is huge: it covers cities from 50,000 to megacities of more than 10 million people.
If you want to explore the distribution of population across cities of different sizes, you can do so in these charts.

Living conditions in urban areas
Urban slums
Urbanization is often associated with higher living standards and better access to basic services — and on average, that pattern holds, as we discuss below. But for hundreds of millions of people, moving to a city has meant living in densely packed settlements without adequate housing or reliable access to clean water and sanitation.
We can see this in the map below, which shows the share of urban residents living in slum households. A slum household is one that lacks at least one of the following: access to clean water, access to sanitation, sufficient living space, or durable housing.7
Globally, around one in four people in urban areas live in slum households. But as the map shows, the share varies widely across regions. In high-income countries, it is close to zero. In most countries across Asia and Latin America, the share is between 10 and 50%. Across sub-Saharan Africa, more than half of urban residents live in slum households; in some countries, such as Chad, the share is closer to 80%.8
Over time, the share has been falling in many countries. One important example is Indonesia: about 35% of the urban population lived in slums in 2000, and by 2022 this share had fallen to around 19%.


Urban vs. rural gaps in basic services
There are many examples — across broad areas of development — that suggest that, on average, living standards are higher in urban populations than in rural ones.9 In urban areas:
- electricity access is higher;
- access to improved sanitation is higher;
- access to improved drinking water is higher;
- access to clean fuels for cooking and heating is higher;
- and child malnutrition is lower.
However, it is difficult to infer causality between urbanization and these examples.
Since urbanization correlates with economic growth (as we explain in detail below), these relationships might just reflect the effect of higher incomes on electricity access, sanitation, drinking water, and nutrition.
There can also be significant inequalities within urban areas, as the data on slum households discussed above makes clear.
Services and infrastructure in urban areas
Public transport
The map shows the share of city residents who live within walking distance of a public transport stop, defined as 500 meters for buses and trams or one kilometer for higher-capacity services like metro and rail. The data comes from the UN and covers cities as defined by the Degree of Urbanisation framework used throughout this page.
Access varies widely across countries. In much of Western Europe, over 90% of city residents live close to a public transport stop. In sub-Saharan Africa, the average is closer to a third, though this ranges from under 10% in countries like Cameroon to over 60% in others like Mali and Rwanda.

Keep in mind that this metric measures proximity to a stop, not the quality of the service. A bus stop served once a day counts the same as one with departures every five minutes.
This means the map likely overstates functional access, particularly in countries where stops exist but services are infrequent or unreliable. The indicator also does not capture informal transport, such as minibuses, shared vans, and motorcycle taxis, which carry a large share of passengers in many African and South Asian cities.
Urbanization and development
The link between urbanization and economic growth
A well-known correlation that is often discussed in development economics is that richer countries tend to be more urbanized.10 The next chart shows this correlation. It plots GDP per capita against the share of population in urban areas using each country’s own national definition of “urban”.

This relationship weakens considerably when urbanization is measured using the standardized Degree of Urbanisation framework, instead of each country’s own national definition. The next chart shows this by plotting GDP per capita against the share of the population in cities, suburbs, and towns. As you can see, there is still a broad relationship, but the correlation is much weaker.11

Why do these two charts look so different? A key reason is measurement.
National definitions vary in ways that are closely tied to income. Many low-income countries use relatively high thresholds or additional criteria (such as the presence of public services), classifying dense towns of several thousand people as “rural”.
This means that national definitions undercount urbanization in poorer countries, which strengthens the apparent link. Because the second chart uses the same density and size thresholds across all countries, this distortion goes away.12
But even setting measurement aside, a simple cross-country comparison does not tell the whole story about the relationship between urbanization and prosperity. To understand why, it helps to distinguish between the micro and macro levels.
At the micro level, density generates economic benefits. When workers and firms cluster together, infrastructure can be shared more efficiently, labor markets allow for greater specialization, and proximity can accelerate the exchange of ideas. The available empirical evidence suggests this is a real, but modest, causal effect.13
At the macro level, the picture is different. Countries that start out more urbanized do not consistently grow faster or slower than those that start out more rural.14
This is because, at the national level, urbanization and economic output tend to move together partly because they are both shaped by a broader process of structural transformation. As agricultural productivity rises, workers move into industry and services, and into denser settlements. But the evidence that urbanization itself drives national economic growth is weak.
Taken together, these findings suggest that a country can achieve high living standards with its population dispersed across well-connected towns or concentrated in large cities. What matters is the form that urbanization takes. Countries where urbanization has been driven by industrialization (as in much of East and Southeast Asia) have generally seen large gains in productivity and living standards. Countries where urbanization has been driven instead by natural-resource revenues, or “rural push” factors such as high rural population growth combined with low agricultural productivity (as in parts of sub-Saharan Africa) have often urbanized without comparable economic gains.15
Urbanization and agricultural employment
The previous section described how urbanization and economic growth tend to be driven by a shared underlying process: as agricultural productivity rises, workers shift away from agriculture into industry and services, and move into denser settlements. The chart here shows that pattern, but from the other side: countries with a larger share of their population living in rural areas tend to have higher shares of employment in agriculture.

As with the urbanization-income relationship discussed in the previous section, the correlation here is also not very strong. Namibia, for example, has a large rural population but relatively little agricultural employment, because its economy is oriented around mining and services.
Bangladesh has only around 2% of its population living in areas classified as rural under this definition, yet a large share of its workforce is still in agriculture. This may seem striking, but this just reflects how density-based definitions work: the country is so densely populated that much of its territory meets the thresholds for towns or cities, even in areas where farming remains the main livelihood.
The shift out of agriculture and the shift into cities do not always happen at the same pace or for the same reasons.16
This is one reason why the decline of agricultural employment is often a more direct signal of structural transformation than urbanization itself. As mentioned in the previous section, urbanization can rise for reasons unrelated to productivity growth, such as resource booms or “rural push” factors.
Different approaches to measuring urbanization
Throughout this page, we’ve used a measurement framework called the Degree of Urbanisation (DEGURBA) to classify settlements as cities, towns, or rural areas. This is the current international standard for measuring urbanization endorsed by the UN Statistical Commission. It applies the same population-density and settlement-size thresholds across countries, so that places can be compared under a shared definition.
Before DEGURBA was adopted, there was no common international standard. Instead, the UN published urbanization estimates based on each country’s own definition. Some sources still publish data on this basis, and these figures can differ substantially from those based on DEGURBA.17
In this section, we explain how these approaches differ, what each measures, and how they relate to long-run historical reconstructions for periods before modern censuses and satellite-based data were available.
The “Degree of Urbanisation” framework
The starting point of this framework is a global grid of 1 kilometer × 1 kilometer cells. Each cell is assigned a population count, estimated by combining census data with satellite imagery of built-up areas.18
Each cell is first classified by its population density, depending on how many people live there. Contiguous high-density cells are then grouped together to see whether they form a settlement with enough people in total to qualify as a city. Medium-density cells are grouped in the same way to identify towns and suburbs. Everything else is classified as rural.
This yields three mutually exclusive categories:
- Cities (densely populated areas): contiguous clusters of 1 km² cells with a density of at least 1,500 inhabitants per km² and a total population of at least 50,000.
- Towns and suburbs (intermediate density areas): “urban clusters” outside cities with a density of at least 300 inhabitants per km² and a total population of at least 5,000 people. This category typically includes smaller towns, suburbs, and peri-urban areas.
- Rural areas (thinly populated areas): grid cells below 300 inhabitants per km², plus denser cells that do not belong to a contiguous cluster meeting the minimum total-population threshold for a town (5,000) or city (50,000).
Because the grid cells are uniform in size and the thresholds are applied in the same way everywhere, settlements are classified under a single common standard, regardless of which country they are in. The classification is also independent of administrative boundaries: a city’s extent is defined by where dense settlement actually exists, not by where municipal lines happen to fall. And by distinguishing towns and suburbs as a separate category, the framework captures a middle ground that isn’t visible in the binary urban-rural split.
The framework was developed by the European Commission, working with the World Bank, the UN’s Food and Agriculture Organization, the International Labour Organization, the OECD, and UN-Habitat. The UN Statistical Commission endorsed it in 2020 as the recommended standard for international comparisons, and the 2025 revision of the World Urbanization Prospects — the UN’s flagship publication on the topic — integrates DEGURBA alongside its traditional national-definitions estimates for the first time.19
The “national definitions” approach
Governments classify their territory into urban and rural areas using their own criteria. Some do this based on administrative status, for example, whether a place is officially designated as a city or town. Others use population thresholds, density thresholds, employment structure, or some combination of these. These classifications are used for domestic planning, budgeting, and maintaining continuity with earlier national statistics.
When international organizations compile urbanization data, one option is to build on these national classifications. Historically, this was the approach used by the UN: its global urbanization estimates were constructed by compiling and aggregating the figures that countries reported under their own national definitions. (The 2025 revision of the World Urbanization Prospects continues to publish national-definitions estimates alongside DEGURBA, mainly for continuity with earlier statistics.)
The main limitation of this approach, compared with DEGURBA, is that the criteria vary widely across countries, which limits comparability. In the absence of a shared standard, similar places can be classified differently from one country to the next. The table below illustrates this with a selection of examples.20
Country | National definition of “urban” |
|---|---|
Argentina | Localities with 2,000 inhabitants or more. |
Sweden | Built-up areas with 200 inhabitants or more and where houses are at most 200 meters apart. |
Japan | Cities are defined as “shi”. In general, “shi” refers to a municipality that satisfies the following conditions: (1) 50,000 inhabitants or more; (2) 60 percent or more of the houses located in the main built-up areas; (3) 60 percent or more of the population (including their dependents) engaged in manufacturing, trade, or other urban types of business. |
India | Statutory places with a municipality, corporation, cantonment board, or notified town area committee and places satisfying all of the following three criteria: (1) 5,000 inhabitants or more; (2) at least 75 percent of the male working population engaged in non-agricultural pursuits; and (3) at least 400 inhabitants per square kilometer. |
Zimbabwe | Places officially designated as urban, as well as places with 2,500 inhabitants or more whose population resides in a compact settlement pattern, and where more than 50 percent of the employed persons are engaged in non-agricultural occupations. |
Singapore | Entire population. |
Uruguay | Cities officially designated as such. |
Not all countries use a population threshold. And among those that do, the threshold varies enormously: Sweden and Denmark count places of just 200 inhabitants as urban, while Japan requires 50,000. The map below shows where countries sit on this spectrum.
Reconstructions from historical sources
Urbanization on the scale we see today is a recent phenomenon in human history. But to trace these changes over the very long run, we need to rely on evidence beyond the methods described above. Gridded population data and satellite imagery only go back a few decades, and even national definitions are part of a broader statistical system that is relatively new.
Because of this, to study urbanization over longer timescales, researchers reconstruct estimates from historical evidence such as censuses, administrative records, archaeological findings, and regional demographic studies. This is painstaking work, and it often requires judgment about how to interpret incomplete evidence and reconcile definitions across very different places and periods.
One such effort is the History Database of the Global Environment (HYDE), which produces long-run estimates of total, urban, and rural population.21 For recent decades, these estimates are aligned with official national population records. For earlier periods, HYDE draws on historical demographic reconstructions and evidence on city populations and settlement patterns to estimate the share of people living in urban areas.
The chart here shows these estimates over time. The long-run historical figures are less precise than modern data, and they depend more heavily on interpretation and modeling assumptions. But the changes over time are large enough that the broad pattern remains meaningful, even if the exact levels come with uncertainty.

Previous version of this page
The previous version of this page was largely structured around the UN’s national definitions series, with a strong focus on the measurement limitations and comparability issues relative to other sources. The earlier version is available via the Wayback Machine.
Featured data on urbanization
Data insights on urbanization
Endnotes
Urbanization is also an explicit global policy priority in the UN’s 11th Sustainable Development Goal to “make cities inclusive, safe, resilient and sustainable.”
This framework was developed by the European Commission together with the OECD, World Bank, FAO, UN-Habitat, and the ILO. You can read more in: UN Statistical Commission (UNSC). 2020. “Report on the Fifty-First Session (3–6 March 2020).” Supplement No. 4 E/2020/24-E/CN.3/2020/37. New York: Economic and Social Council, Official Records.
For context, Manhattan has a density of around 28,000 per square kilometer, which is nearly 20 times higher.
We focus here on urbanization trends as defined by the main settlement categories in the Degree of Urbanisation framework. You can read more about urbanization in sub-Saharan Africa, including a more detailed descriptive analysis under alternative specifications, in this World Bank paper: https://documents1.worldbank.org/curated/en/099415311272320571/pdf/IDU0faef6c000aaba0485209f0e08928760d9a57.pdf
We rely here on the Degree of Urbanisation (DEGURBA) framework, which defines cities based on population density and size rather than national administrative boundaries. Jakarta’s population, for example, includes the wider contiguous urban area beyond DKI Jakarta. You can read more about DEGURBA and how these definitions compare to national statistical records in our section on the different approaches to measuring urbanization.
As with other city data on this page, these figures use a consistent global definition of city boundaries based on satellite data, allowing comparisons across countries. Some capitals do not appear in the dataset because they do not meet the density and population thresholds required to qualify as a city under DEGURBA. Canberra is one example; a number of small-island and purely administrative capitals fall into the same category. Read more in our section on the different approaches to measuring urbanization.
UN-Habitat defines a slum household as one where residents lack at least one of the following: durable housing that protects against extreme climate; sufficient living space (no more than three people per room); access to safe water in adequate amounts; or access to adequate sanitation. A fifth criterion — security of tenure — is part of the official definition but is inconsistently applied across countries and often excluded from national estimates due to data limitations.
This is a measure of household-level deprivation, not a spatial classification: a household can score poorly on these criteria without living in what urban planners would classify as an informal settlement, and vice versa.
The conditions of deprivation vary considerably: some households lack only one criterion, others lack several.
It is also worth noting that many rural households in these same countries would also fail at least one of the same criteria, especially safe water and sanitation. We cover urban-rural comparisons below.
In all the charts listed in this section, we rely on the definitions of “urban” and “rural” provided by the source. In most cases, these refer to national definitions, rather than the harmonized, density-based classification from the Degree of Urbanisation framework that we rely on across other sections of this page.
For references, see Bloom, D. E., Canning, D., & Fink, G. (2008). Urbanization and the wealth of nations. Science, 319(5864), 772–775. Available at: https://doi.org/10.1126/science.1153057.
In this other chart, you can see that it doesn’t change the conclusion if you only plot the population in cities instead
You can read more about this and explore further sensitivity checks in Dijkstra, Lewis, et al. “Applying the degree of urbanisation to the globe: A new harmonised definition reveals a different picture of global urbanisation.” Journal of Urban Economics 125 (2021): 103312. Available at: https://doi.org/10.1016/j.jue.2020.103312.
Combes, P.-P., & Gobillon, L. (2015). The empirics of agglomeration economies. In G. Duranton, J. V. Henderson, & W. C. Strange (Eds.), Handbook of Regional and Urban Economics (Vol. 5, pp. 247–348). Elsevier. Ahlfeldt, G. M., Redding, S. J., Sturm, D. M., & Wolf, N. (2015). The economics of density: Evidence from the Berlin Wall. Econometrica, 83(6), 2127–2189. De la Roca, J., & Puga, D. (2017). Learning by working in big cities. Review of Economic Studies, 84(1), 106–142. Donovan, S., de Graaff, T., de Groot, H. L. F., & Koopmans, C. (2024). Unraveling urban advantages: A meta-analysis of agglomeration economies. Journal of Economic Surveys.
Bloom, D. E., Canning, D., & Fink, G. (2008). Urbanization and the wealth of nations. Science, 319(5864), 772–775. Available at: https://doi.org/10.1126/science.1153057.
Gollin, Douglas, Remi Jedwab, and Dietrich Vollrath. “Urbanization with and without industrialization.” Journal of Economic Growth 21, no. 1 (2016): 35–70. Available at: https://doi.org/10.1007/s10887-015-9121-4. Jedwab, R., & Vollrath, D. (2015). Urbanization without growth in historical perspective. Explorations in Economic History, 58, 1–21. Available at: https://doi.org/10.1016/j.eeh.2015.09.002.
Gollin, Douglas, Remi Jedwab, and Dietrich Vollrath. “Urbanization with and without industrialization.” Journal of Economic Growth 21, no. 1 (2016): 35–70. Available at: https://doi.org/10.1007/s10887-015-9121-4.
The previous version of this page was largely structured around the UN’s national definitions series, with a strong focus on the measurement limitations and comparability issues relative to other sources. The earlier version is available via the Wayback Machine.
The satellite imagery underlying the population grids extends back to the mid-1970s. Estimates for earlier periods, including the 1950 figures shown on this page, rely more heavily on census records and statistical modeling, and are less precise.
United Nations, Department of Economic and Social Affairs, Population Division (2025). World Urbanization Prospects 2025: Summary of Results. Available at: https://population.un.org/wup/.
The UN World Urbanization Prospects database also provides a full downloadable list of statistical definitions for each country.
Klein Goldewijk, K., Beusen, A., Doelman, J., and Stehfest, E. (2017). Anthropogenic land use estimates for the Holocene – HYDE 3.2. Earth System Science Data, 9, 927–953. Available at: https://doi.org/10.5194/essd-9-927-2017.
Cite this work
Our articles and data visualizations rely on work from many different people and organizations. When citing this topic page, please also cite the underlying data sources. This topic page can be cited as:
Esteban Ortiz-Ospina, Veronika Samborska, Hannah Ritchie, and Max Roser (2024) - “Urbanization” Published online at OurWorldinData.org. Retrieved from: 'https://ourworldindata.org/urbanization' [Online Resource]BibTeX citation
@article{owid-urbanization,
    author = {Esteban Ortiz-Ospina and Veronika Samborska and Hannah Ritchie and Max Roser},
    title = {Urbanization},
    journal = {Our World in Data},
    year = {2024},
    note = {https://ourworldindata.org/urbanization}
}
Reuse this work freely
All visualizations, data, and articles produced by Our World in Data are completely open access under the Creative Commons BY license. You have the permission to use, distribute, and reproduce these in any medium, provided the source and authors are credited.
The data produced by third parties and made available by Our World in Data is subject to the license terms from the original third-party authors. We will always indicate the original source of the data in our documentation, so you should always check the license of any such third-party data before use and redistribution.
All of our charts can be embedded in any site.